You’d think with all the major indexes down in bear market territory we’d be near a bottom.
Heck, cult stocks like Netflix Inc. (NASDAQ: NFLX) are off more than 70% YTD…
Bitcoin is down just as much.
Thankfully, my students are staying safe, being selective on what trades they’re taking and managing risk like seasoned pros.
Now you’re probably thinking, what does a penny stock trader know about calling market bottoms?
After decades of trading, I learned that many of the same rules apply to indexes as they do to OTC stocks.
In fact, there are 3 TELLS which can point you towards a market bottom.
Most traders are unaware of what they are, but I’m going to tell you right now…
1. High Volume Reversal
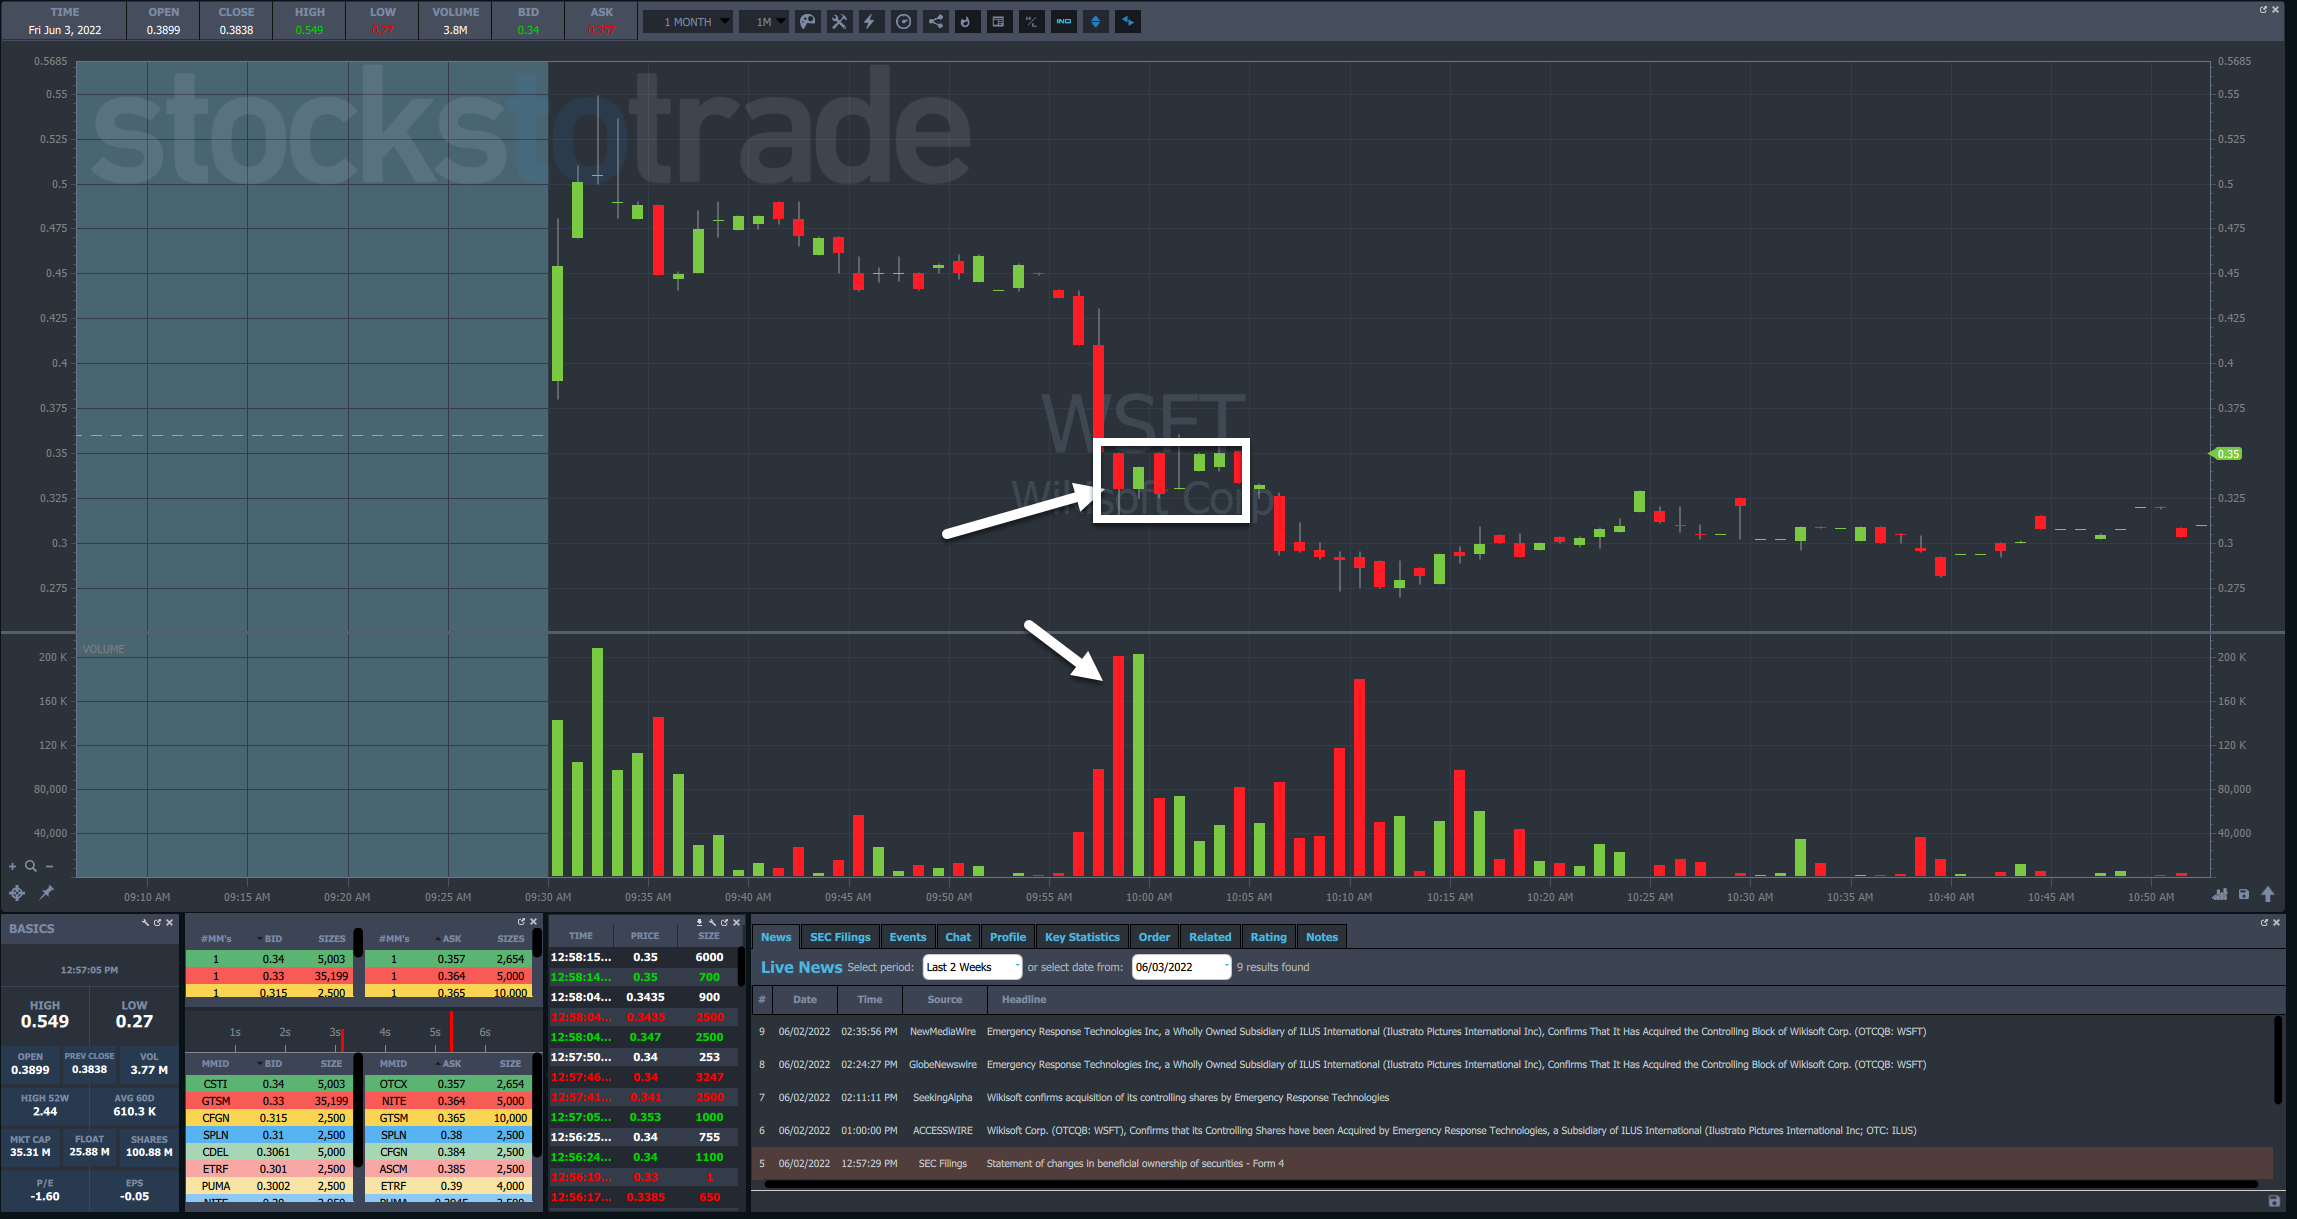
An easy way to identify a reversal on any chart is to look for a high volume reversal.
This is one of the most tried and true ways to identify how a stock is doing.
One of my favorite setups right now is the morning panic dip buy.
In the last few weeks, I’ve used this strategy on countless charts as promoters step in to stop a sliding stock.
WikiSoft Corp. (OTC: WSFT) is a great example of a trade where I used this tactic into a heavy volume selloff.
Finding these points is fairly straightforward.
You look for outsized volume relative to recent candles around it.
With intraday charts, this can be a bit tricky around the open because there’s typically heavy volume at that time.
That’s why Tim Bohen advocates for waiting until after 9:45 a.m. to get a clearer picture of things.
Now this same concept applies as much to the SPDR S&P 500 ETF (ARCX: SPY) as it does to any penny stock.
While the volume discrepancies won’t be as obvious, there are still clear times when the SPY hits and bounces with heavy volume.
This makes it twice as important if this occurs at a key support level.
Prior lows and consolidation areas are great reference points.
2. Max Panic

I remember clearly when the market bottomed in 2009. There was a video of the stock exchanges where it was so quiet you could hear a pin drop.
Everyone looked completely worn out.
That’s what we need in order for a market or any stock to bottom – capitulation.
It’s more than just heavy volume and everyone selling out of their shares.
I want to start hearing questions like ‘how much further can we drop’ when the market is already down 30%, 40%, or even 50%.
You’ll see it on television when the promoters that they parade onto CNBC start to get cautious — folks that have been long-term bulls.
A great way to track this is through social media and general headlines.
It’s a lot like bubbles. When people who rarely discuss the markets start talking about it, you know things have shifted.
3. Headwinds Subside

I’m not a big fundamentals person. Especially as a penny stock trader.
But it doesn’t take much business sense to know that markets reflect the outlook for companies and those companies reflect the outlook for the economy.
Right now, all of those things face serious challenges, from supply chain congestion to oil supply, not to mention a central bank determined to crash the economy as it tries to fight inflation well after the fact.
At the same time, that’s giving me lots of trading opportunities on tiny oil and gas plays.
Eventually, those will disappear when energy falls out of favor.
But for the broader market to finally hit a bottom, it needs to forecast things getting better, or at the very least not any worse.
Final Thoughts
This isn’t the type of situation where it pays to call bottoms ahead of time.
I learned the best way to trade the market is to remain patient, cut losses quickly, and limit my risk until things become more clear.
That’s exactly what I’ve taught my students and why I’m proud to continue to add to the growing list of those becoming millionaire traders.
I want you to join them.
Take the first step and sign up for my millionaire challenge by clicking here.
—Tim
The post 3 Ways To Identify A Market Bottom appeared first on Timothy Sykes.


